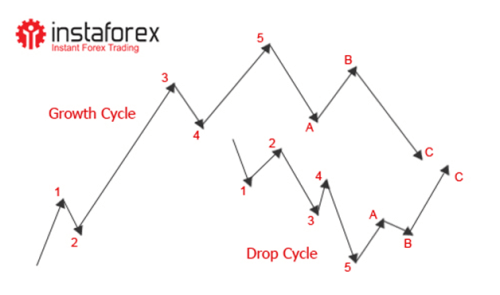
According to the Elliot wave theory, the price movements of any currency can be depicted on the chart in the form of waves. Waves are subdivided into three impulse waves, directed towards the main trend, and two corrective waves directed against the trend. These waves are marked with numbers 1, 2, 3, 4, 5. When the active development of the trend is over, begins the correction of the price movement which is depicted with three waves on the chart. Two of these waves are motive, one of them is a corrective. These waves are marked as A, B and C.
The point of the wave analysis is that the price movement is natural and always unfolds in one and the same pattern. The application of the wave analysis on Forex enables to forecast the price behavior on the particular part of the trend movement and successfully close the deal in due time.
To mitigate the risks of losses and set the proper level of Stop loss, it is necessary to consider the length of waves. As a rule, the longer the impulse wave is, the longer will be corrective ones.
The main difficulty of using wave analysis is to define the exact size of the wave. To forecast effectively the price movement, it is necessary to identify exactly which waves are impulse and which ones are corrective. As a rule, corrective waves are the most hard to identify.
The application of wave analysis enables a trader to define precisely the behavior of the price on the particular timeframe. This method of forecasting the situation can become one of the most important and effective instruments of a professional trader.
No comments:
Post a Comment